

Author note: This update (10/9/26) combines an original version (10/3/23) with a closely related followup post (11/24/24), and incorporates editing and elaborating to make everything fit together.
Think you know what behavior analysis is? I contend that in order to be sure of that you also need to know what behavior analysis isn’t, and also what it’s related to. I didn’t just make that criterion up. A voluminous research literature says that discrimination learning is driven, in essence, by relational frames: You need experience with both S+ and S-, and ideally multiple exemplars of both.
Put into plain English, this means that to understand behavior analysis you need to know how it’s situated in the broad context of science and knowledge, a context that could include a lot of stuff you don’t think of as behavior analytic. But so be it. What we do can only be understood in reference to what’s done elsewhere. This post presents one simple example.
End of an Era in Behavioral Research… But What an Era
Every behavior analyst with any amount of exposure to basic behavioral science knows about the cumulative record, a technique for registering the response-by-response progress of an experiment that B.F. Skinner leaned on heavily during the laboratory phase of his career.
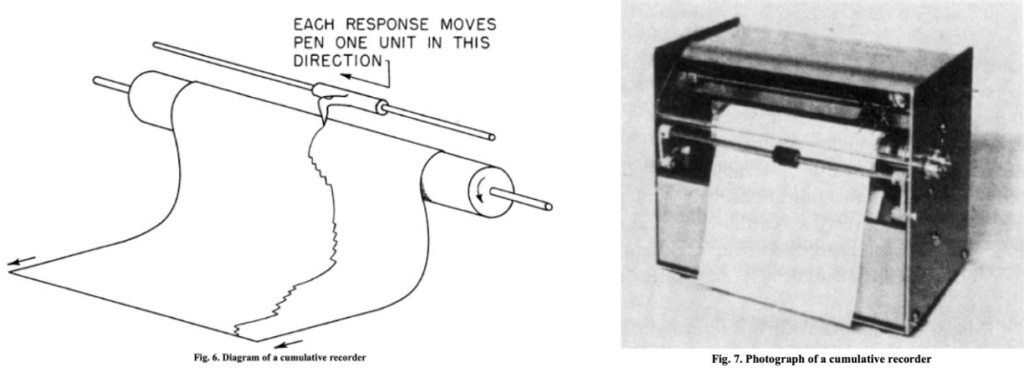
Skinner considered the cumulative recorder to be one of his most important innovations in methodology. During a relatively brief period, roughly 1940-1960, cumulative records dominated the data of the experimental analysis of behavior. Their impact crested with Ferster and Skinner’s voluminous Schedules of Reinforcement (available inexpensively from the B.F. Skinner Foundation), which presented over 900 figures, many containing multiple cumulative records. My rough estimate: Over 1300 total cumulative records in one publication! (see Note 1).
Note 1: Fab Four
Schedule effects count as one of the great discoveries in the history of Psychology. They show a previously-unimaginable kind of orderliness in behavior that holds across species, response modes, and time scales. Cumulative records lend coherence and accessibility to the byzantine world of reinforcement schedules. If schedules are the Beatles of behavior science, the cumulative record would be their producer extraordinaire, George Martin.

To wit, here’s what W.H. Morse and P.B. Dews wrote in their foreword to a 1997 reprinting of Schedules of Reinforcement:
It was the cumulative recorder that permitted the recognition of the powerful effects of schedules. The information shown in a cumulative record is … contained in a series of blips corresponding to the steps on a horizontal line of a polygraph…. Changes in rate of responding, indicated by changes in slope, are more obvious in the cumulative record than in a polygraph. The cumulative record shows at a glance the pattern of changes in rate of responding in real time over periods of hours or longer. The characteristic properties of different schedules would not have been discovered without the cumulative recorder.
Put simply, some of the earliest and most impactful chapters of our science’s story are writ in the language of cumulative records.
If you’re into a deep historical dive into the technology of cumulative recorders, you can read Andy Lattal’s lovely “biography” of the machine Skinner devised (“Steps and pips in the history of the cumulative recorder“). But the key point for present purposes is very general and nontechnical: Cumulative records were great at capturing moment-to-moment variation in response rate. As a result, they were perfectly suited to illuminate behavior dynamics in schedules of reinforcement, which often produced highly predictable moment-to-moment changes in behavior (see Note 2).
Note 2: The human touch
All of Skinner’s seminal research was with animals, but I had heard that around 1950 Ogden Lindsley produced the first cumulative record of human behavior made by a Skinner-style cumulative recorder (this is before Lindsley’s groundbreaking study of psychiatric patients, which was one of the very first systematic efforts at studying human operant behavior). Lindsley’s daughter Cathy had had an air crib, and he attached a cumulative recorder, though I’m not sure what kind of responses were collected. Lindsley presented Cathy’s cumulative record at a meeting of the Eastern Psychological Association circa 1951, but he never published it, and it’s unclear whether it still exists. But in October of 2023, Scott Born wrote to say the following:
In May, 2021, Nancy Hughes, Ogden’s widow, and I were dredging out the last effluvia from the tiny Behavior Research Company building in Kansas City….In the utility closet… I noticed that someone had, long before, put a wooden box on a cement paver to keep things that could be water-damaged propped up. I thought I might use the box for something, so I pulled it out. It was that very cumulative recorder for Cathy Lindsley’s air crib! Years before Og died, around 2001, I did an ABA presentation on air cribs. I interviewed everyone I could identify as having used them. In talking to Ogden, he said he wished he had kept Cathy’s. He had.

A bit of history! If you know what happened to that first cumulative record, I’d love to hear about it!
In any case, once human behavioral research got going, it quickly mimicked the tactics pioneered in the animal lab, including reliance on cumulative records to capture patterns in behavior. For example, here’s an example from one of Sidney Bijou’s (1957) early studies, “Patterns of Reinforcement and Resistance to Extinction in Young Children.” It shows that, in children as in lab animals, behavior under extinction is stronger following intermittent reinforcement than continuous reinforcement (important because when operant research was first extended to humans nobody was sure about the extent to which behavior patterns and principles would replicate across species).

However, with the publication of Sidman’s (1960) Tactics of Scientific Research came a major shift in the style of behavioral research. Sidman persuasively advocated for using steady-state reversal designs, which have many advantages when it comes to unambiguously demonstrating experimental control. Within a decade or so these designs had begun to overrun the experimental analysis of behavior, leaving little oxygen for Skinner’s inductive, momentary approach.
The death knell of the cumulative record was sounded by Skinner himself in a short 1976 essay — call it a eulogy — bemoaning what was lost when we gave up the cumulative record as a way of examining changes in behavior (see Note 3).
Note 3: Eulogy
If you detect a heavy dose of religious fervor about the magic that cumulative records could create, or if you just don’t feel like reading right now, then perhaps you’ll appreciate this audio rendering of “Farewell, my LOVELY!” as a sermon. For information on the track’s provenance see this post.

For an explanation of the specific selection pressures that drew behavior analysts away from the cumulative record, see Peter Killeen’s excellent “Reflections on a cumulative record.” But Skinner had read the tea leaves right: Cumulative records rapidly faded from prominence in behavioral research, and today are seen today in our literature only very rarely (though see Note 4).
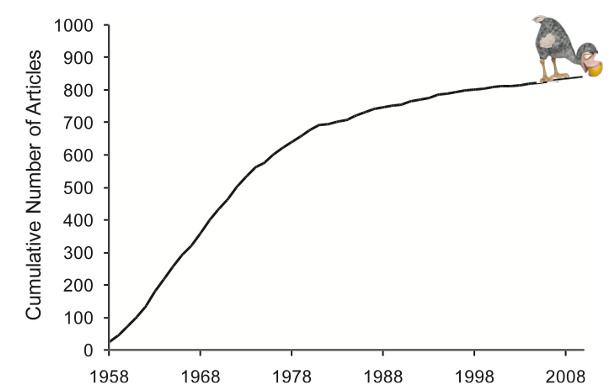
Note 4: Holdouts
Cumulative records didn’t ENTIRELY disappear, but they became a rarity. When I worked in Andy Lattal’s pigeon lab in the late 1980s, cumulative records were still the primary data record for selected studies like the one that produced this record that I have posted on my office wall. The record reminds me of the good old days when you could HEAR your experiment unfolding (the recorder made a distinctive click with each response, and the different response patters yielded different click symphonies). I also appreciate the reminder that a voluminous research project was made up of micro-level moments that are visible in the record and informative in their own right — but lost in the aggregation of data that takes place when preparing the typical journal article. All that being said, you might be able to find your way to my office in Illinois to see this one for yourself quicker than you can find a new one in a behavioral journal.

The funny thing about mourning the loss of the cumulative record is that technically we never really “owned” it in the first place. By that I mean two things:
- Contrary to what you might think (and what Skinner implied in his own writings), Skinner did not invent the cumulative record. He adapted a well-accepted mode of data display to behavioral research, but the general approach had been around for a very long time.
- Behavioral research may have moved on from the cumulative record, but the world outside of behavior analysis remains enamored of how well cumulative graphs accomplish what they were built to: depict dynamic changes in rate over time.
Below I will briefly defend both points.
Forgotten Forebears
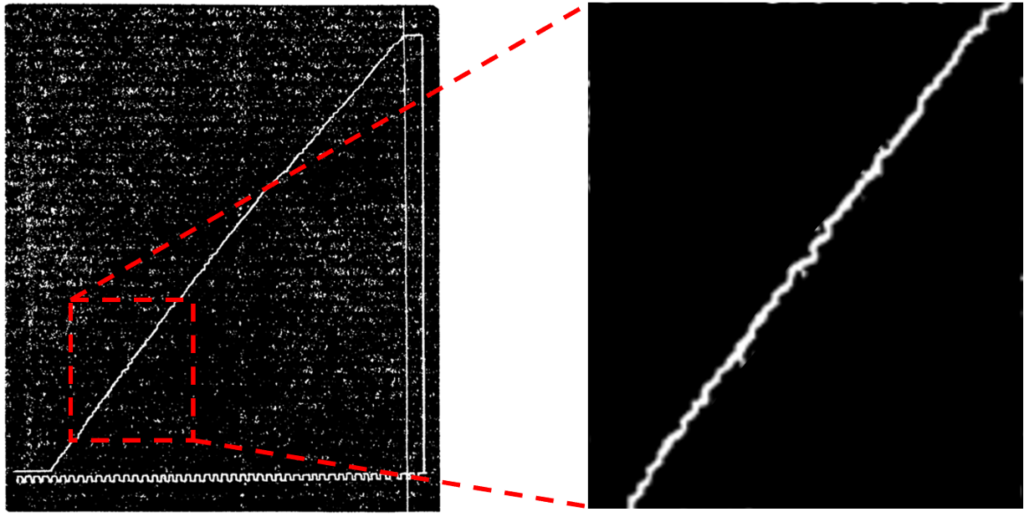
For this section I draw heavily on Jim Todd’s 2017 paper in Mexican Journal of Behavior Analysis, “A selective look at some pre-Skinnerian cumulative recording systems and cumulative records in physiology and psychology” (download full text here). Todd reports that devices similar to cumulative recorders were widely used to measure physiological outcomes (like respiration) in German medicine in the latter half of the 19th Century. And he says that possibly the “earliest published cumulative record of psychologically significant behavior” traces to 1882, when Fletcher P. Dressler of Clark University was key pressing during the sending of Morse code (below).
Thereafter, a number of individuals who trained at Clark employed similar devices, as per a 1907 study by James Slonaker focusing on rat behavior in a running wheel.
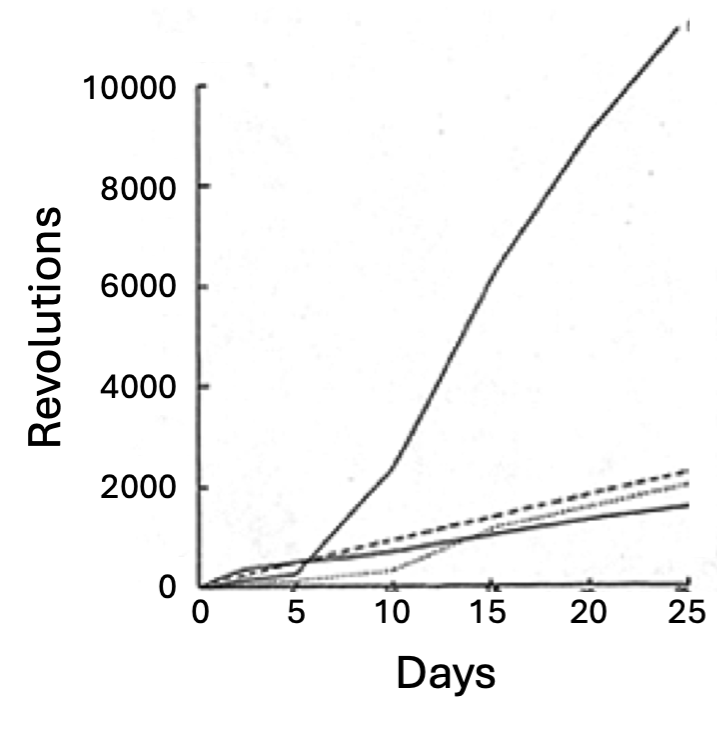
The Todd article contains a lot of cool insights into early cumulative displays, but you get the idea: Cumulative records were out there along before Skinner used them. Interestingly, in Skinner (in places like Behavior of Organisms and “Case history in scientific method”) acknowledged no debt to the earlier work. He described his development of cumulative recording devices as rather contingency-shaped during exploratory research. But it’s hard to imagine that Skinner, a voracious reader, was completely unaware of the many relevant examples from the history of psychology and physiology.
Reports of My Death Have Been Greatly Exaggerated
Behavioral researchers may have given up on the cumulative record, but in popular culture cumulative graphs remain in good favor for the very reason that Skinner appreciated them: They convey quite intuitively how rate changes in real time. They have visual oomph, as detailed nicely in a discussion in the UCLA Anderson Review about better and worse ways of presenting data on COVID-19 cases.
Consequently, people whose job is to communicate effectively about data rely heavily on cumulative graphs when they need to show how events change in rate over time. Let’s briefly examine five contemporary examples.
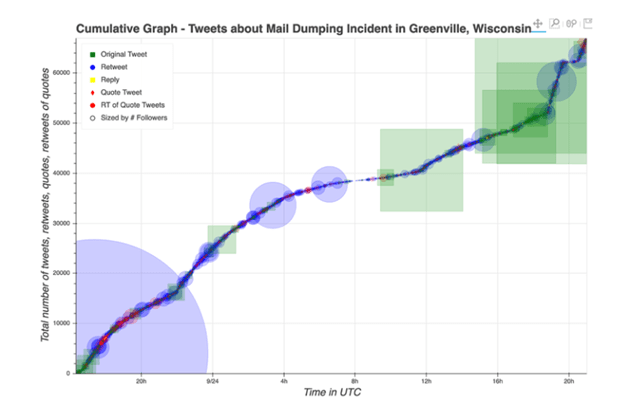
1. This graph shows the real-time online virality of rumors about a purported incident of ballot fraud during the 2020 U.S. President Election. You don’t have to be a behavioral scientist to perceive the momentary ebbs and flows in the rate of relevant digital traffic.
2. Cumulative graphs especially excel at comparing the relative rates of two or more events. Here’s a graphic showing how COVID-19 cases accelerated in several countries near the start of the pandemic. You don’t have to be an epidemiologist to tell which country did the poorest job of containment (see Note 5).

Note 5: As long as we’re doing diseases…
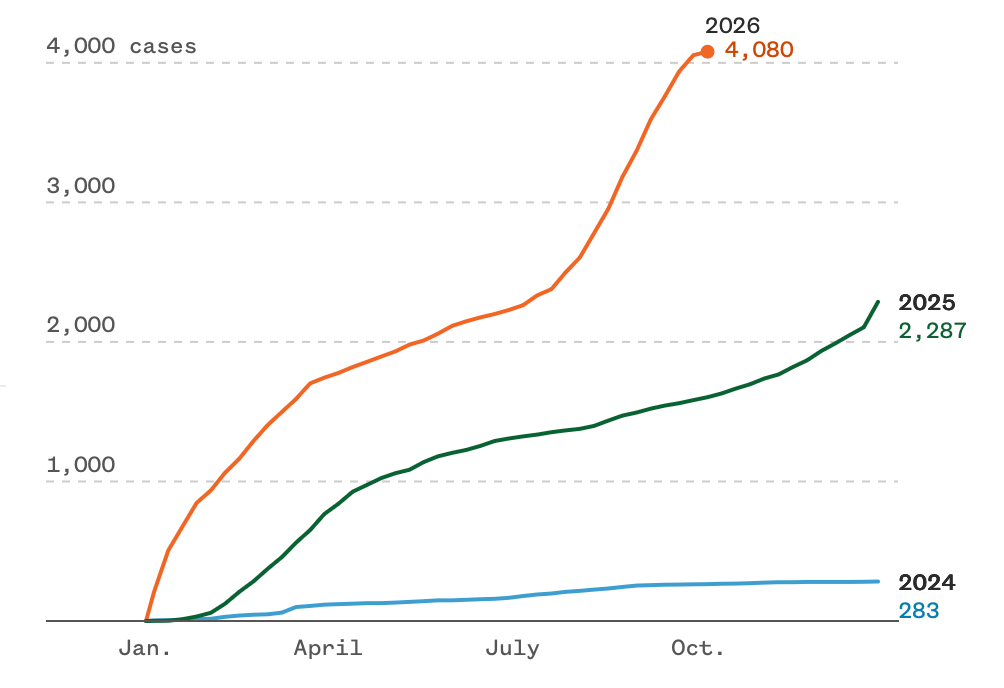
Update 10/14/26: To continue a theme, here’s a graph from NBCNews.com (paywall) showing the erosion of measles mitigation in the U.S.: cumulative cases for three consecutive years.
3. And here’s an accounting of the famous (to baseball fans) 1998 season-long quest by two players to break the “unbreakable” record for home runs in a season set by Babe Ruth 71 years previous.

You needn’t know a lot about baseball to understand the fine grain of behavior that excited baseball fans. Would Ruth’s “unbreakable” 71-year-old record of 60 home runs finally fall? [It did.] If so, who would ultimately win the suspenseful cat-and-mouse game played by Sosa and McGwire? [McGwire, but Sosa matched him a few times near season’s end, and both players ultimately beat Ruth’s record.]
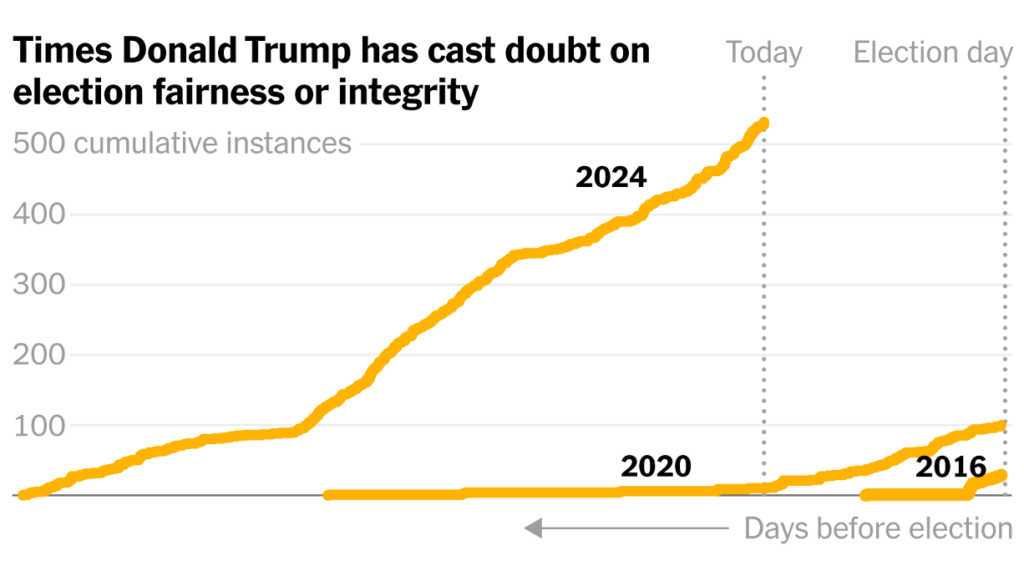
4. Here’s a political example from the New York Times. This one shows Donald Trump’s rate of publicly complaining about supposed 2020 election fraud, in relation to upcoming elections. It’s easy to see that with each successive contest, Trump began his fear mongering earlier, and accelerated more as the election approached.
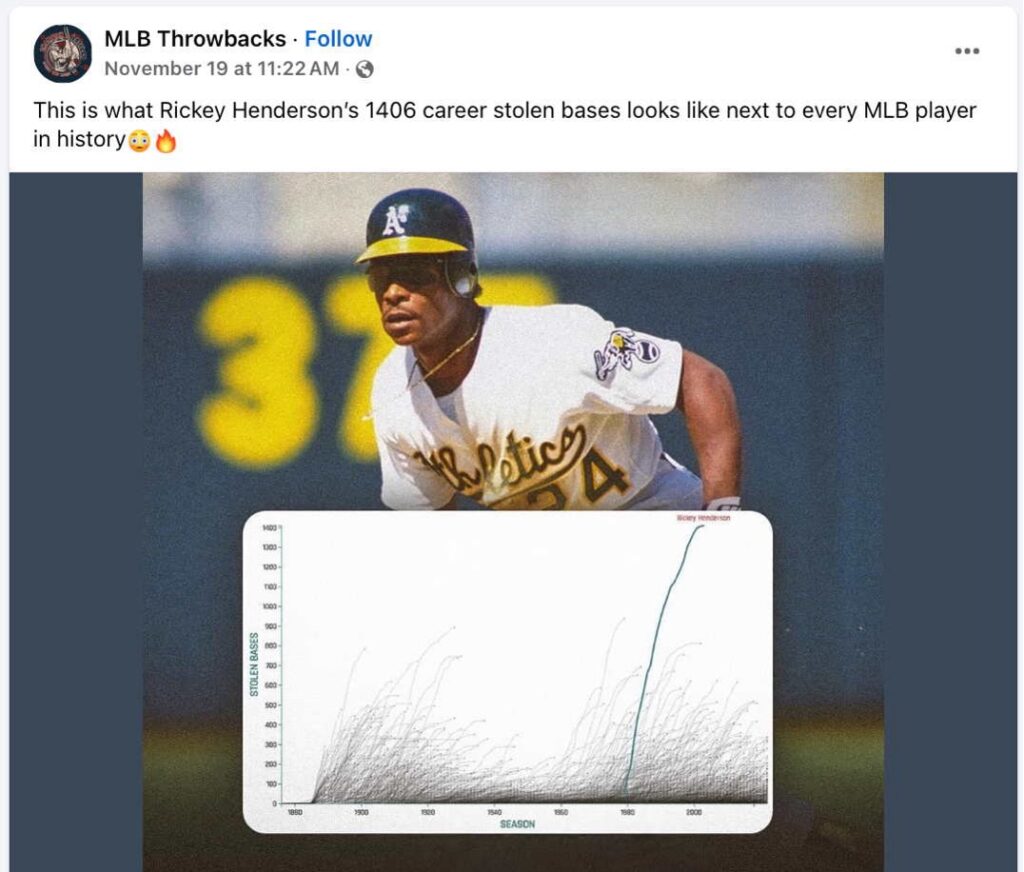
5. I can’t resist finishing with what I regard as the most impressive cumulative graph ever produced, this one also from baseball. I’m going to spend a few extra moments on this one to pinpoint some of the nuances that are easy to discern in a cumulative record.
The MLB Throwbacks Facebook page featured the following post to highlight the uniqueness of baseball’s all-time base-stealing leader, the great Rickey Henderson. Each cumulative curve in the graph represents one of the more than 20,000 individuals who have played major league baseball. The time (horizontal) axis measures baseball seasons, and the behavior (vertical) axis counts stolen bases.
To accentuate the nuances, here’s an expanded view of the graph.

You don’t have to know baseball to see that Henderson was special. His curve is steeper than most others, meaning that he averaged more stolen bases per season than just about anybody. His curve reaches higher than all the others, meaning that his career total far exceeds that of the next-best player. And a close look reveals that, for most players, the stolen-base curve is steep at first, then tails off (flattens) at the end, meaning that as players age they tend to steal fewer bases in a season. By contrast, Henderson’s curve is much closer to linear, which means that his prowess was unusually resistant to age effects.
Final Thoughts
In one sense this post is a casual stroll down memory lane. If, like many behavior analysts, your entire career has unfolded in the post-cumulative-record era, then you might regard this post’s topic as esoteric, something with as much practical relevance to contemporary life as the telegraph or the typewriter.
But I hope this post reminds that nothing in science occurs in a vacuum. There is always an informative context, if you choose to attend to it. The extremely long lifespan of the cumulative graph — extending well before and after Skinner — suggests it’s less like the telegraph or typewriter and more like the fork or the plow, something designed long ago but still quite good at what it’s for.
Which raises interesting questions about why we in behavior analysis have largely lost interest in what it’s for.
All of the examples shown here focus on how events accumulate as a function of time. And all of them, to some degree, have that visual oomph I spoke about earlier.
It is often said that the purpose of graphing data is to pass the “interocular percussion” test, in which important effects hit the observer right between the eyes. As I’ve shown, cumulative records do that exceptionally well for certain kinds of effects.
And those are the kinds of effects that, conceptually, we most celebrate in discussing our science. In simple terms, what we do is engineer variables that demonstrably make things happen. That’s true in the lab, and it’s true in the field, and the simplest way to see behavior changing is to watch it in real time. It’s powerful to see that when Thing A happens, Thing B (behavior change) follows close on its heels.
I’m old enough to remember when just about every Psychology Department had a student rat lab, where operant principles were put to work with a living subject. Those labs existed for a very good reason: Nothing compared to them in terms of making the power of Psychology come alive. It wasn’t rare in those days for students (even some who feared rats and/or the technical mumbo jumbo of behavior analysis) claim that “rat lab” that it was the best part of their college careers.
Of course we can’t give everyone who needs to know about behavior analysis a rat lab experience, but we can do more to rely on communication tools (like, but not limited to, the cumulative record) that highlight the dramatic changes in behavior that occur when the contingencies are right.
Unfortunately, our research traditions over the past many decades have de-emphasized those exciting momentary changes in behavior. Instead we rely almost exclusively on steady-state designs (e.g., reversals, multiple baseline) in which the key data are averages of many observations. Moment-to-moment behavior dynamics get lost in the averaging. And with those effects are lost potential opportunities to excite in the way “rat lab” once did.
The take-home: If cumulative graphs can make pandemic trends transparent to nonscientists, or base-stealing history clear to non baseball fans, then surely they still have the potential to communicate to non behavior analysts about how effectively we can change behavior.